
Social media analytics for small business, in plain words
Every platform's numbers in one place, what each post brought in, and whether engaging paid off. Then Kebo tells you what to do more of.

 New post

 Ask Kebo
 Instagram
 TikTokKebo's readWhat your numbers say, and what to do next
Thursday brunch posts get 1.4× the saves of your average across 6 posts.
Adjust scheduleReels that open on the pour hold attention for 5.1 s, twice your other openers.
Review Reels22 conversations started in the inbox this month. 9 ended in a booking.
Open messagesKebo's readWhat your numbers sayThursday brunch posts get 1.4× the saves of your average across 6 posts.
Adjust scheduleWhat Analytics does for you
What every post and conversation led to, in plain words.
 Kebo's read
, in plain words
Views, reach, saves and followers from every platform in one place, with a short read on what changed and what to do about it.
- Against the weeks before, not industry averages
- One clear next step
- Feeds straight into next week's plan
Kebo's readKeep two carousels a week; open Reels on the pour.The formats, hooks and times that win
See which formats, pillars, hooks and posting times work for your account, so next week's plan does more of what works.
- Formats and pillars compared
- Hooks that hold attention
- Best days and times

@ana.lx
Followed you after a comment
You commented on @timeoutlisboa's brunch post
Mon 09:12 · Engagement
@ana.lx followed you
Mon 11:40 · New follower
She asked about a table for 6 on Saturday
Tue 08:05 · DM
Came in for brunch with 5 friends
Sat 09:30 · Customer
Who came back after you showed up
Kebo connects engagement and replies to what happened next: who followed, who came back within a week and who became a customer.
- Days you engaged against quiet days
- People who followed after a reply
- Customers tagged from the Inbox
Analytics in three steps
Connect your accounts
Kebo reads each platform's own numbers, from Reels watch time to Threads link clicks.
Read Kebo's take
Three findings in plain words, each with the action that follows from it.
Turn it into next week
Review any post and add the ideas that come out of it straight into this week's plan.
Everything in Analytics
All platforms together
Instagram, Facebook, Threads and TikTok side by side, each with its own numbers.
Kebo's read
What your numbers say and what to do next, without digging through charts.
What works
The formats, hooks, pillars, days and times that win for you.
Your best times
When your audience is online, used as suggestions when you schedule.
Did engaging pay off?
Days you engaged against quiet days, and who came back within a week.
Post reviews
Any post against your usual, what worked, what didn't, and ideas to try next.
Analytics for your kind of business
The same feature, working for three very different examples. Open one to see a week of it.
 K&CKiln & CoHandmade ceramics
E-commerce brands
Product posts, carousels and DM sales for Shopify and Etsy-style shops
See it for e-commerce brands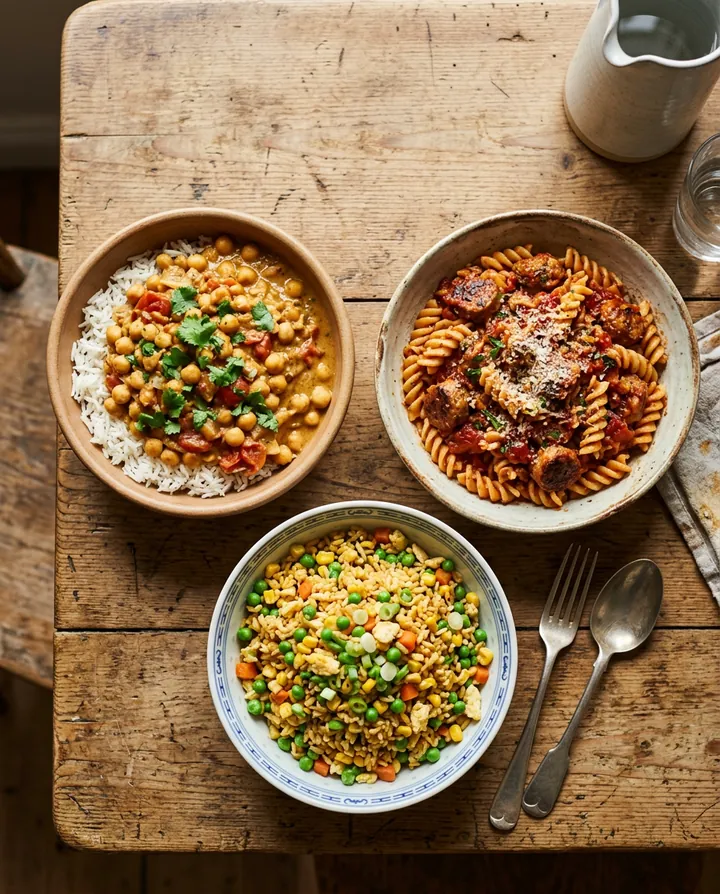
 Tom FraserBudget home cookingTom FraserLast 30 days
Content creators
Grow a personal brand you can earn from, without burning out
See it for content creators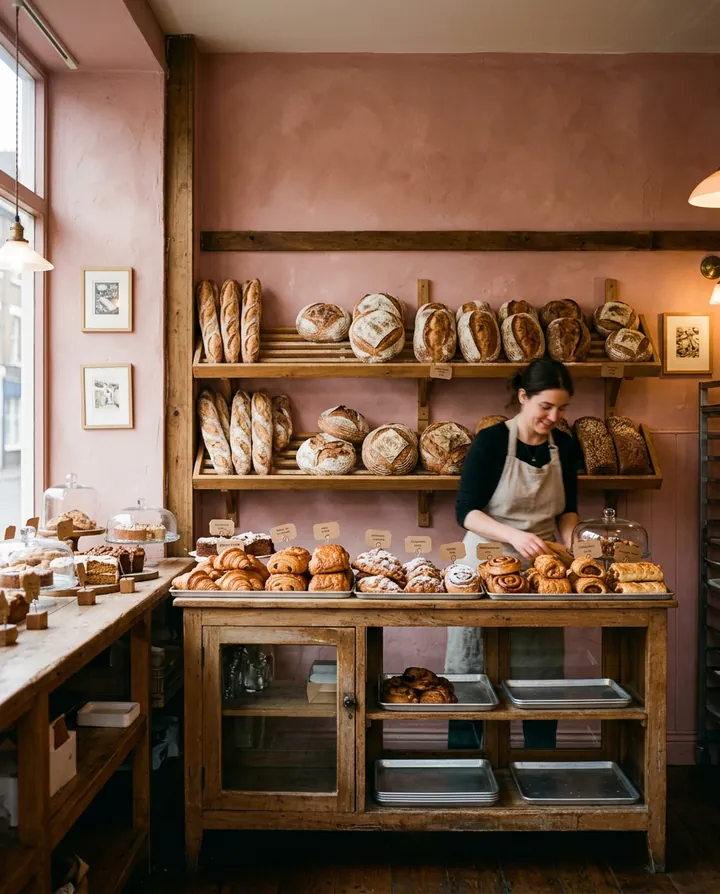 R&RRye & RoseNeighbourhood bakery
Local businesses
For shops, bakeries, florists, gyms and studios on the high street
See it for local businessesAnalytics: questions owners ask
Which analytics does Kebo show?
Each platform's own numbers: views, reach, saves, shares, watch time, followers and more, depending on what Instagram, Facebook, Threads and TikTok report.
How is this different from Instagram Insights?
Kebo puts every platform in one place, compares posts against your own usual, and tells you what to do next in plain words.
Is analytics on the free plan?
Yes. Analytics is included on every plan, including free.
Can Kebo tell me the best time to post?
Yes, from your own audience and results. Those times show up as suggestions when you schedule in the Publisher.
Guides and articles
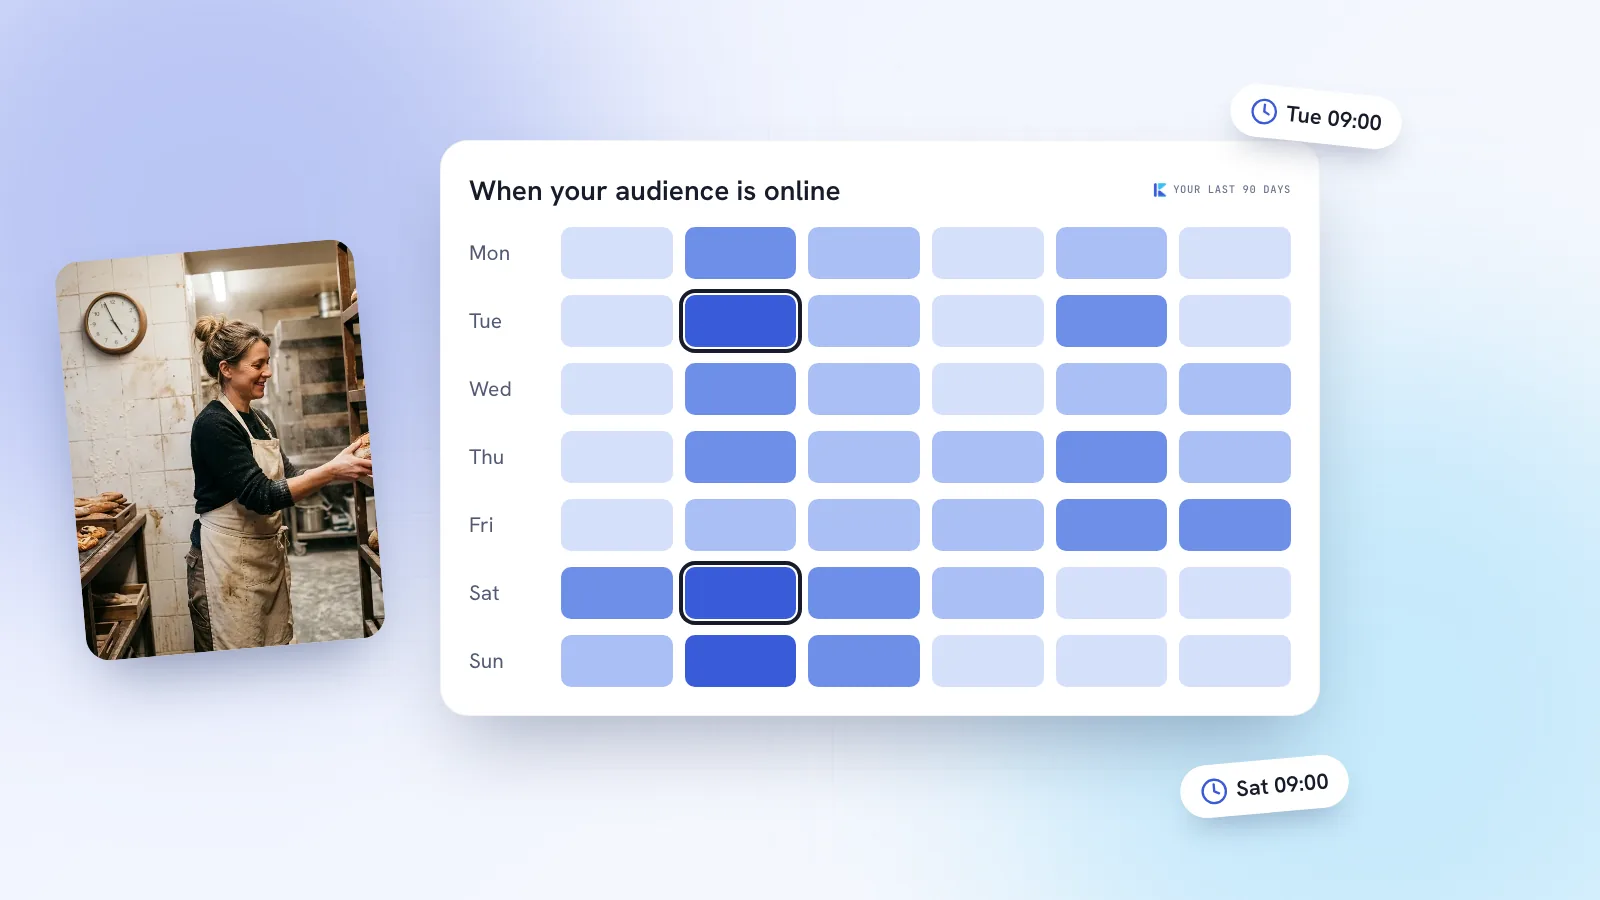
Best time to post on Instagram, TikTok and Facebook (2026 data)
The best time to post on Instagram, TikTok and Facebook in 2026, with six big studies compared side by side, every day of the week, and how to find your own.
27 October 2026 · 10 min read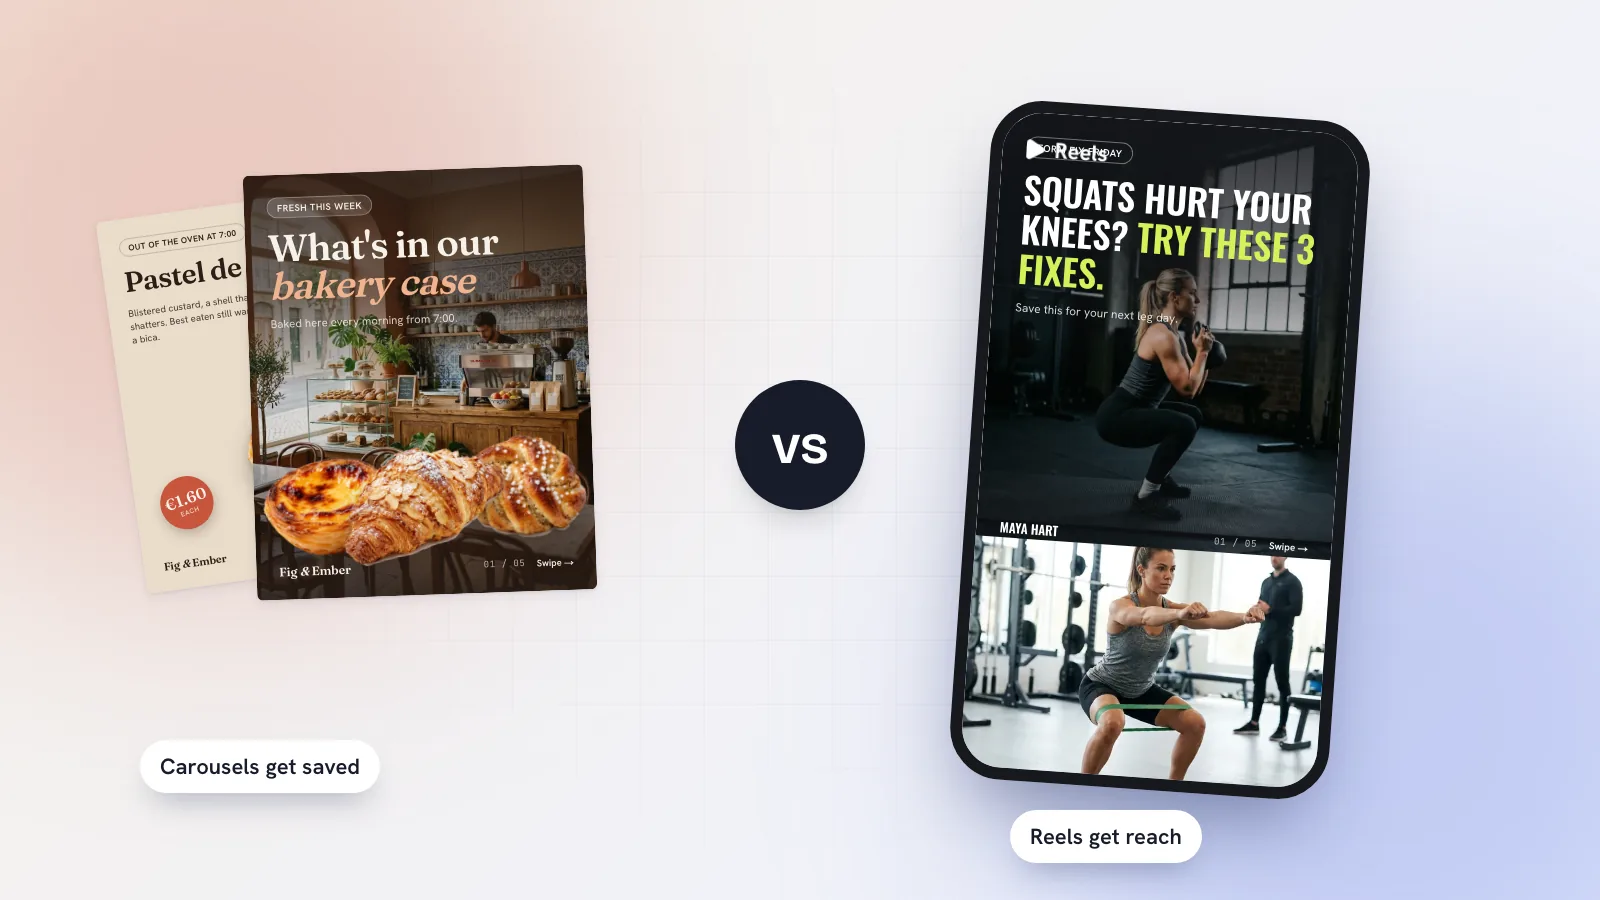
Carousels vs Reels in 2026: what a small business should post
Carousels vs Reels in 2026: what each Instagram format is good at, when a small business should use which, and a simple weekly mix that works for most teams.
27 October 2026 · 5 min read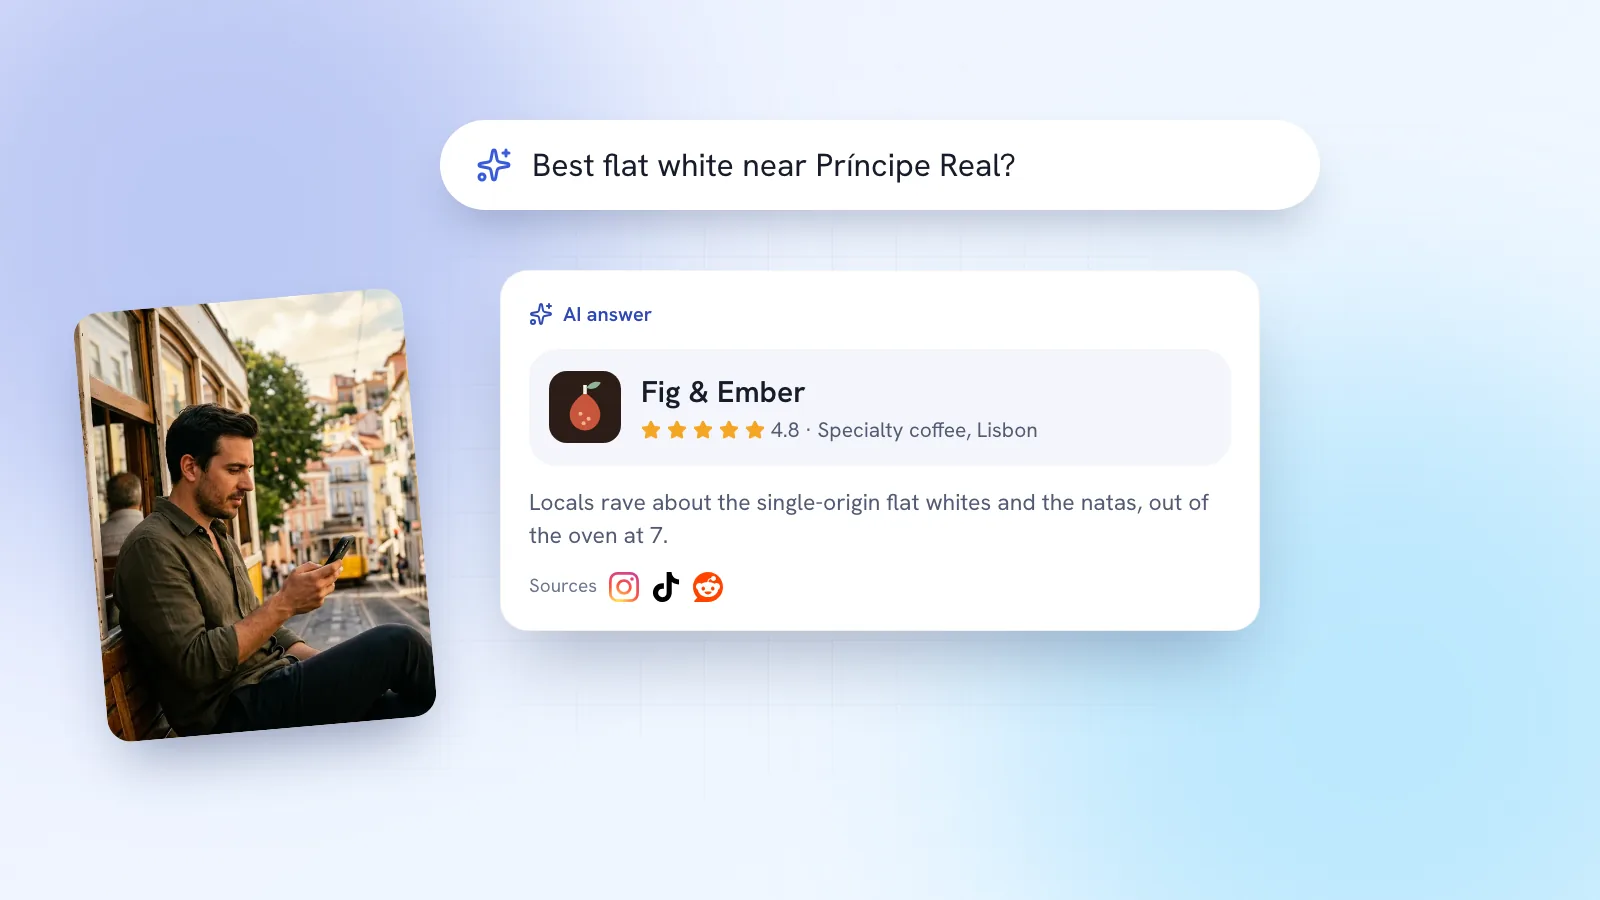
How to show up in social search and AI answers
How to show up in social search and AI answers: search-friendly profiles and captions, keywords said and shown in video, consistent details and quotable posts.
27 October 2026 · 6 min readGive your socials a team
Start free in minutes. No card needed, and you can upgrade whenever you're ready.